

PostgreSQL® metrics exposed in Grafana®#
The metrics/dashboard integration in the Aiven console enables you to push PostgreSQL® metrics to an external endpoint like Datadog or to create an integration and a prebuilt dashboard in Aiven for Grafana®. For more information on enabling the integration, see Monitor PostgreSQL® metrics with Grafana®. This article describes the default dashboard created in Grafana for any PostgreSQL instance.
General info about default dashboards#
A few key points about the default dashboards pre-created by Aiven in Grafana:
The PostgreSQL dashboards show all tables and indexes for all logical databases since Aiven cannot determine tables or indexes relevance.
Some metrics are gathered but not shown in the default dashboard, you can access all available metrics by creating new dashboards.
New dashboards can be created to show any metrics or use any filtering criteria. The default dashboard can be used as a template to make the process easier.
Warning
When creating new dashboards, do not prefix the names with “Aiven” because they may be removed or replaced. The “Aiven” prefix is used to identify Aiven’s system-managed dashboards. This also applies to the default dashboard, for which any direct editing to it could be lost.
PostgreSQL metrics prebuilt dashboard#
The PostgreSQL default dashboard is split into several sections under two main categories: Generic and PostgreSQL. Generic metrics are not specific to the type of service running on the node and mostly related to CPU, memory, disk, and network. PostgreSQL metrics are specific for the service.
General metrics#
Overview#
This section shows a high-level overview of the service node health. Major issues with the service are often visible directly in this section.
Note
In the Overview section, the figures for Business and Premium services are averages of all nodes that belong to the service. For some metrics, such as disk space, this typically does not matter since it’s equal across all the nodes. For other metrics, especially when related to load concentrated only on the primary node, high values can be dampened by the average. Node-specific values are shown in the system metrics section.
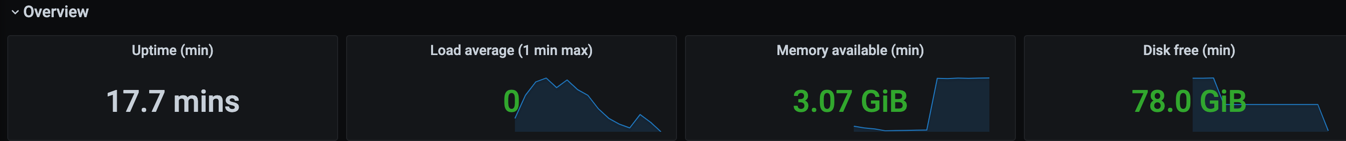
The following metrics are shown
Parameter Name |
Parameter Definition |
Additional Notes |
|---|---|---|
|
The time the service has been up and running. |
|
|
The number of processes that would want to run. |
If the |
|
Memory not allocated by running processes. |
|
|
Amount of unused disk space. |
System metrics#
This section shows a more detailed listing of various generic system-related metrics.
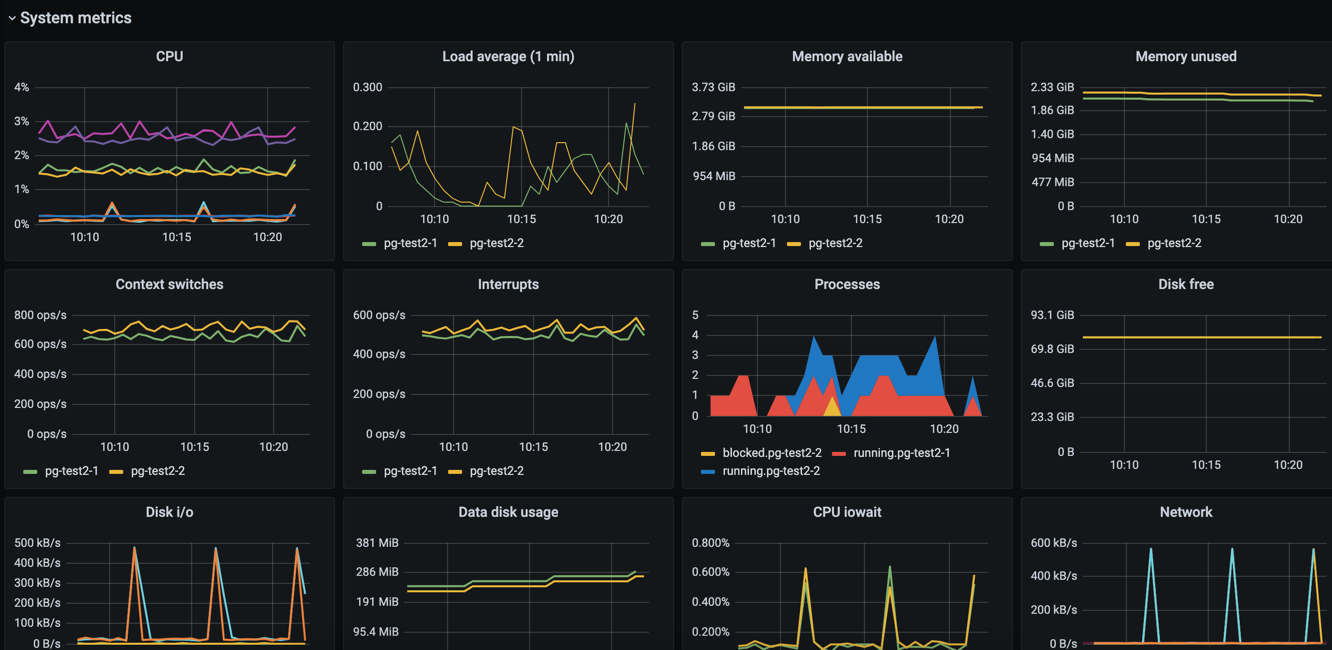
The following metrics are shown
Parameter Name |
Parameter Definition |
Additional Notes |
|---|---|---|
|
|
A high |
|
The number of processes that would want to run. |
the |
|
The amount of memory not allocated by running processes. |
|
|
The amount of memory not allocated by running processes or used for buffer caches. |
|
|
The number of switches from one process or thread to another. |
|
|
The number of interrupts per second. |
|
|
The number of processes that are actively doing something. |
Processes that are mostly idle are not included. |
|
The current amount of remaining disk space. |
Aiven suggest to actively monitor this value and associate it with an alert. The database will stop working correctly if it runs out of disk space. |
|
The number of bytes read and written per second on each of the nodes. |
|
|
The amount of disk space that is in use on the service’s data disk. |
|
|
The percentage of CPU time spent waiting for the disk to become available for read and write operations |
Aiven suggest to create an alert that is triggered when |
|
The number of inbound and outbound bytes per second for a node. |
|
|
The same as the |
|
|
The number of open TCP connections, grouped by node. |
|
|
The number of TCP connections across all service nodes, grouped by the TCP connection state. |
PostgreSQL-specific metrics#
For most metrics, the metric name identifies the internal PostgreSQL statistics view. See the PostgreSQL documentation for more detailed explanations of the various metric values.
Metrics that are currently recorded but not shown in the default dashboard include postgresql.pg_stat_bgwriter and postgresql.pg_class metrics as a whole, as well as some individual values from other metrics.
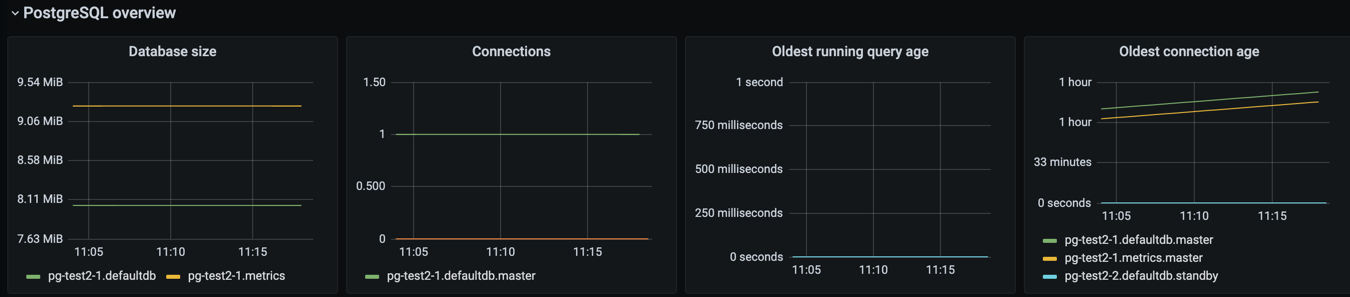
PostgreSQL overview#
The metrics in the PostgreSQL overview section are grouped by logical database. In addition, some metrics are grouped by host.
Parameter Name |
Parameter Definition |
Additional Notes |
|---|---|---|
|
The size of the files associated with a logical database |
Some potentially large files that are not included in this value. Most notably, the write-ahead log (WAL) is not included in the size of the logical databases as it is not tied to any specific logical database. |
|
The number of open connections to the database |
Each connection puts a large burden on the PostgreSQL server and this number should typically be fairly small even for large plans. Use connection pooling to reduce the number of connections to the actual database server. |
|
The age of the oldest running query |
Typical queries run in milliseconds, and having queries that run for minutes often indicates an issue. |
|
The age of the oldest connection. |
Old open connections with open transactions are a problem, because they prevent |
|
The number of commits per second |
|
|
The number of rollbacks per second |
|
|
The number of 8 kB disk blocks that PostgreSQL reads per second, excluding reads that were satisfied by the buffer cache. |
The read operations may have been satisfied by the operating system’s file system cache. |
|
The number of 8 kB disk blocks that PostgreSQL reads per second that were already in buffer cache. |
|
|
The number of temporary files that PostgreSQL created per minute. |
Temporary files are usually created when a query requests a large result set that can’t fit in memory and needs to be sorted or when a query joins large result sets. A high number of temporary files or temporary file bytes may indicate that you should increase the working memory setting. |
|
The number of bytes written to temporary files per second |
This value should be kept at reasonable levels to avoid the server becoming IO-bound from having to write so much data to temporary files. |
|
The number of deadlocks per minute. |
Deadlocks occur when different transactions obtain row-level locks for two or more of the same rows in a different order. You can resolve deadlock situations by retrying the transactions on the client side, but deadlocks can create significant bottlenecks and high counts are something that you should investigate. |
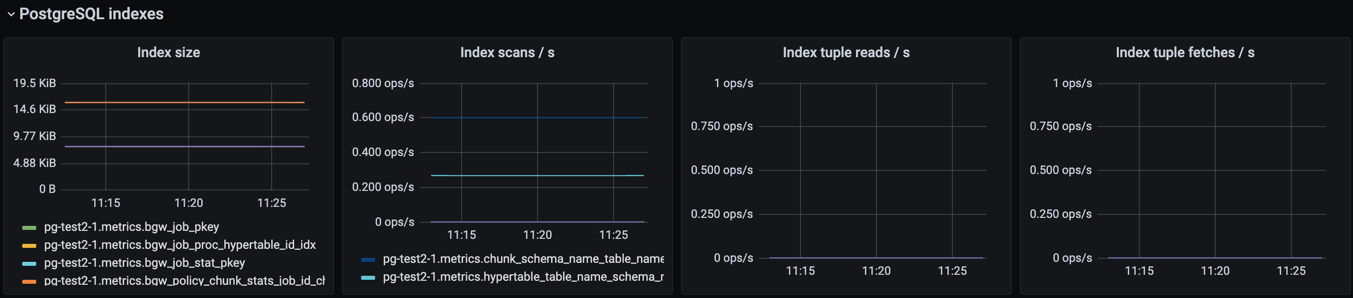
PostgreSQL indexes#
This section contains graphs related to the size and use of indexes. Since the default dashboard contains all indexes in all logical databases, it is easily convoluted for complex databases.
Tip
You might want to make a copy of the default dashboard and add additional constraints for the graphs to filter out uninteresting indexes. For example, for the size graph, you might want to include only indexes that are above X megabytes in size.
Parameter Name |
Parameter Definition |
Additional Notes |
|---|---|---|
|
The size of indexes on disk |
|
|
The number of scans per second per index |
|
|
The number or tuples read from an index during index scans |
|
|
The number of table rows fetched during index scans |
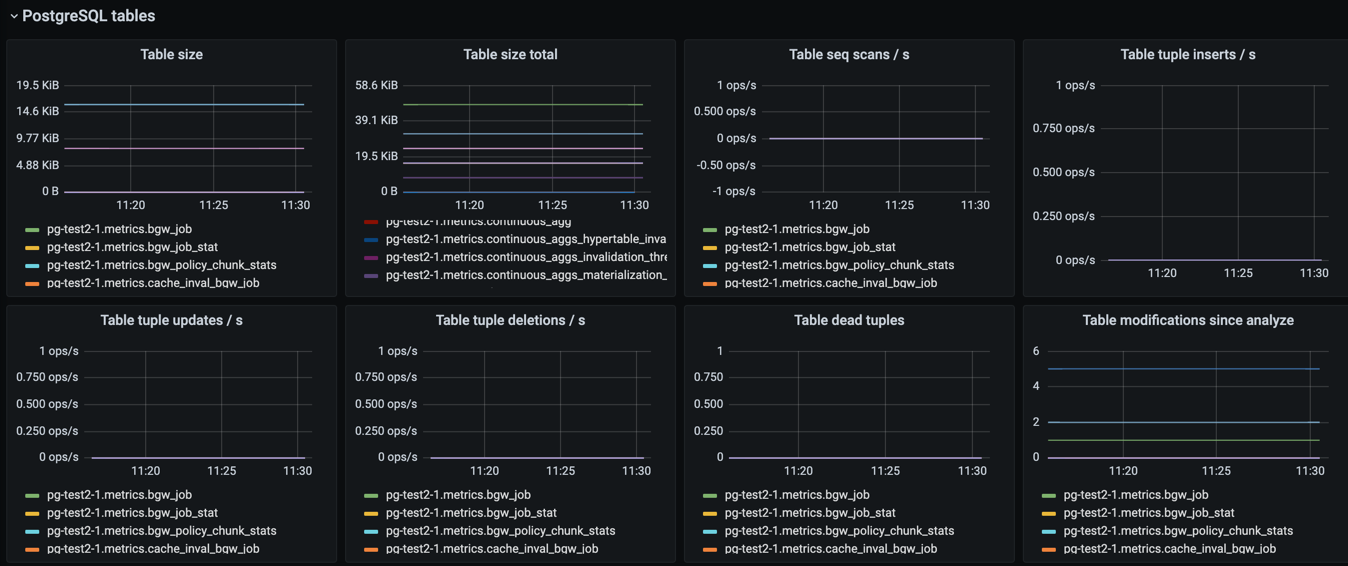
Tables#
This section contains graphs related to the size and use of tables. As with indexes, the graph will be convoluted for complex databases, and you may want to make a copy of the dashboard to add additional filters that exclude uninteresting tables.
Parameter Name |
Parameter Definition |
Additional Notes |
|---|---|---|
|
The size of tables, excluding indexes and TOAST data |
|
|
The total size of tables, including indexes and TOAST data |
|
|
The number of sequential scans per table per second |
For small tables, sequential scans may be the best way of accessing the table data and having a lot of sequential scans may be normal, but for larger tables, sequential scans should be very rare. |
|
The number of tuples inserted per second |
|
|
The number of tuples updated per second |
|
|
The number of tuples deleted per second |
|
|
The number of rows that have become un-referenced due to an update or deletion for the same row, and uncommitted transactions older than the update or delete operation are no longer running. The rows will be marked reusable during the next |
High values here may indicate that vacuuming is not aggressive enough. Consider adjusting its configuration to make it run more often, because frequent vacuums reduce table bloat and make the system work better. The |
|
The number of inserts, updates, or deletions since the last |
A high number for this parameter means that the query planner may end up creating bad query plans because it is operating on obsolete data. Vacuuming also performs |
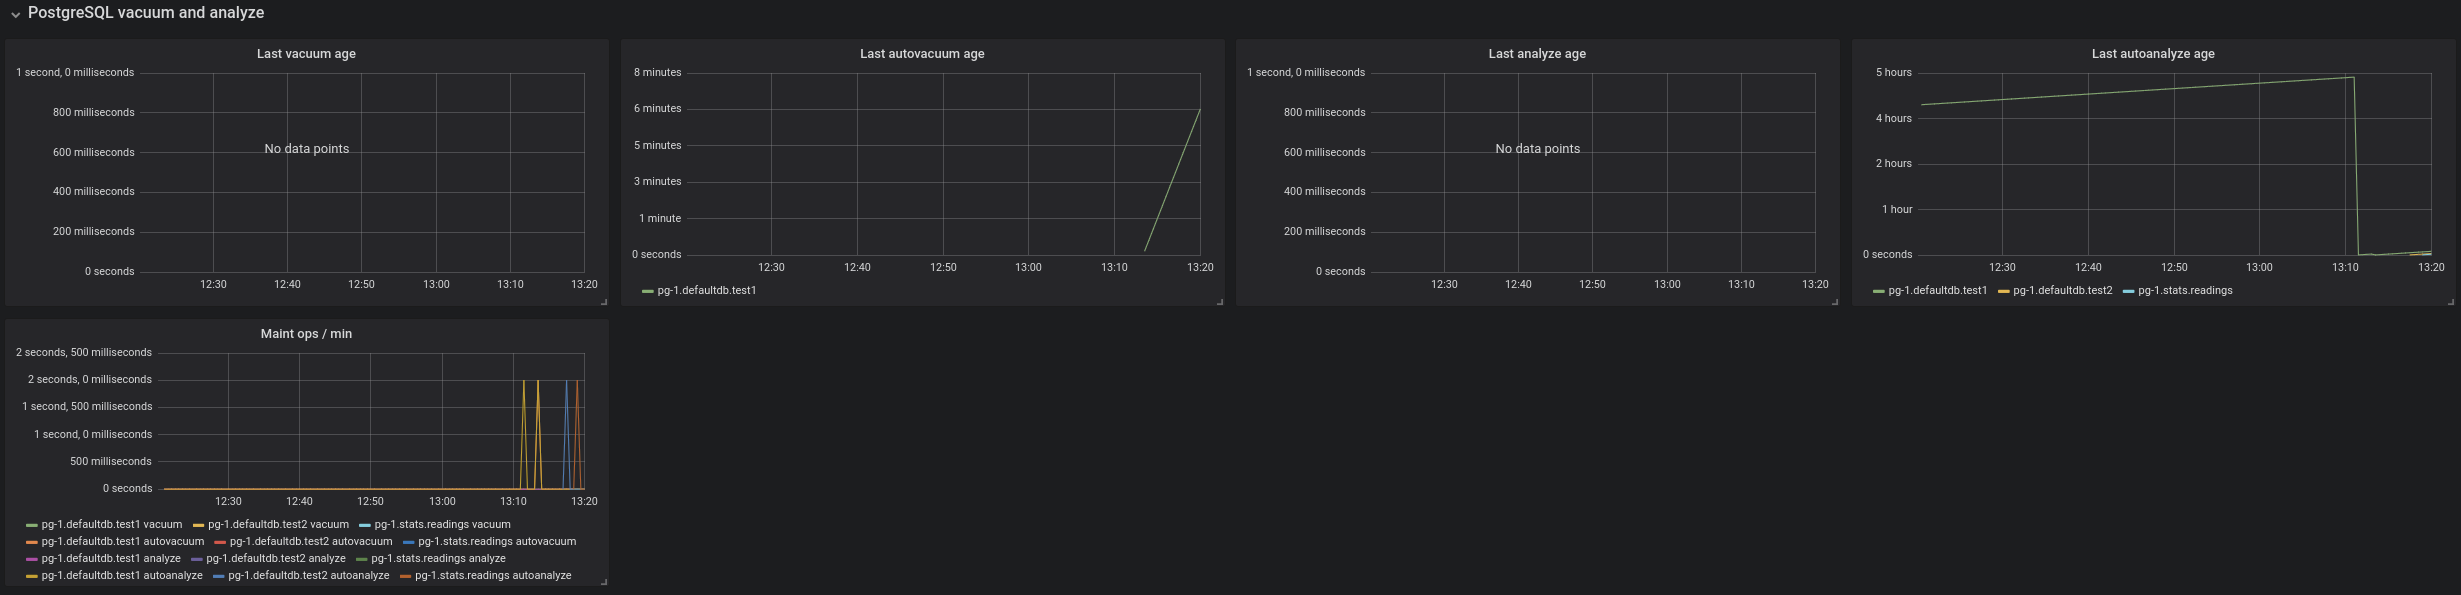
PostgreSQL vacuum and analyse#
This section contains graphs related to vacuum and analyze operations. The graphs are grouped by table and, for complex databases, you probably want to add additional filter criteria to only show results where values are outside the expected range.
Parameter Name |
Parameter Definition |
Additional Notes |
|---|---|---|
|
Time since the last manual vacuum operation for a table |
|
|
Time since the last automatic vacuum operation for a table |
|
|
Time since the last manual analyze operation for a table |
|
|
Time since last automatic analyze operation for a table |
|
|
The number of vacuum and analyze operations per table, per minute |
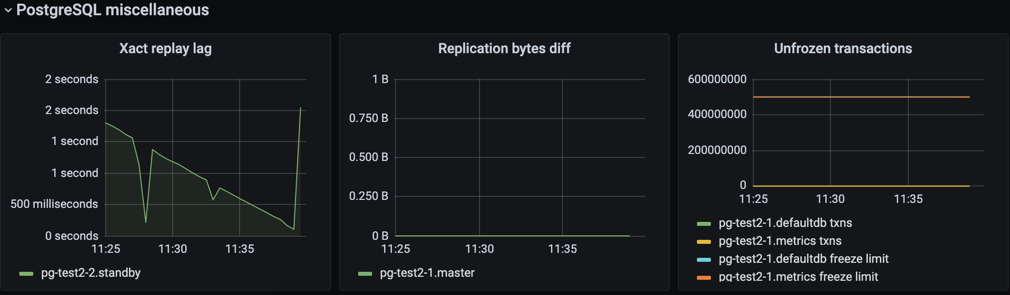
PostgreSQL miscellaneous#
This section contains PostgreSQL metrics graphs that are not covered by the previous sections.
Parameter Name |
Parameter Definition |
Additional Notes |
|---|---|---|
|
The replication lag between primary and standby nodes |
|
|
The replication lag in bytes. This is the total diff across all replication clients. |
To differentiate between different standby nodes, you can additionally group by the |
|
The number of transactions that have not been frozen as well as the freeze limit |
In very busy systems, the number of transactions that have not been frozen by vacuum operations may rise rapidly and you should monitor this value to ensure the freeze limit is not reached. Reaching the limit causes the system to stop working. If the |